

Widely known for its rich diversity and subsequent market opportunities, India is one of the most preferred destinations for sourcing and investment by global businesses. ‘India development indicators’ presents four key indices which are major factors considered by enterprises before investing in the country. The data is represented in the form of geospatial heatmaps illustrating each economic indicator at the district level on geographical map of India. The intensity of the color relates greater or lesser value of the indicator in each district.
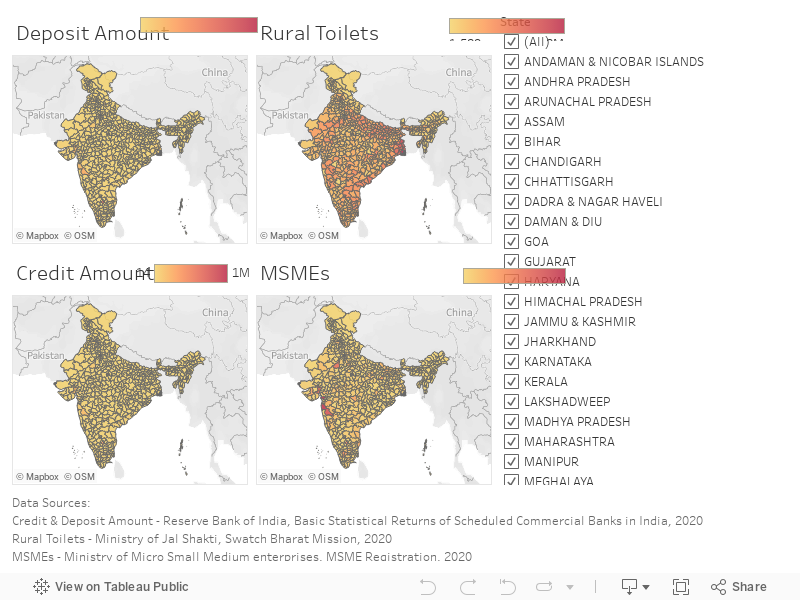
For instance, if we look for Rural Toilets in the state of Gujrat, the district Banaskantha with highest number of rural toilets is highlighted in the dark red tone, whereas district Porbandar with least number of toilets is indicated in light yellow. A careful glance at first chart in the dashboard reveals the density of deposited amount in crore rupees from national to regional level. Highlighted with darker tones, districts lying in the western region of Indian map including Mumbai, Mumbai Suburban, Ahmedabad, Pune, Thane, show higher deposit amount in Crore Rupees. However, a clearer differentiation can be seen on studying the districts tier-wise. Delhi notches the highest deposit amount with over 1.23 crore rupees, followed by Mumbai with over 1.19 crore rupees, and Bangalore about 6.89 lakh rupees worth of deposit amount. It is clear that districts comprising of the first-tier cities like Delhi, Mumbai, Bangalore, Ahmedabad, and Vadodara to name a few, depict the highest deposit amounts followed by those with the lower tier cities, while a significant number of districts spanning rural areas have minimal or no deposit amount reported.
Likewise, the second chart depicts the credit amount in crore rupees a higher credit amount in crore rupees can be observed in the western region of represented map of India. In the southern region, Chennai is the district reporting highest credit amount with credit amount worth over 4.5 lac crore rupees, followed by Bangalore with over 4.4 lac crore rupees. Again, a clearer picture can be drawn by studying the districts tier-wise. Delhi is represented in dark red, reporting highest credit amount of more than 1.36 crore rupees, followed by Mumbai with credit amount of over 1.33 crore rupees, followed by Chennai and Bangalore respectively.
Further, the third chart represents the number of rural toilets reported in 2020. Here, South Twenty-Four Parganas district of West Bengal leads the list with 1.5 million rural toilets reported, whereas Nicobar District of Andaman and Nicobar Islands is reported to have the least number of rural toilets. Again, the intensity of the hue traces the distribution of number of rural toilets in each region. Looking at the chart regionally, the western, eastern, and northern-central regions respectively, represented in dark orange to red color tones represent a higher concentration of rural toilets, while districts in extreme northern, north-eastern and southern show least number of rural toilets.
Moreover, an overview of Micro, Small and Medium Enterprises (MSMEs) distribution in the country, is evoked by the fourth chart. Here, Surat district of Gujrat dominates with over 3.14 lakh reported MSMEs, followed by Thane, Maharashtra with more than 2.99 lakh MSMEs. A regional analysis of the geospatial chart shows that western part has the highest concentration of MSMEs, followed by northern, southern, and eastern regions respectively.
Conclusively, the disposition of Indian economic indicators is analogous to the diversity in Indian culture and languages. The multidimensional analysis of the depicted variables, points towards the scope of improvement in rural markets which can be critical for attracting international investments. While the data suggests promising market growth in Indian semi-rural and urban districts, a better focus towards rural districts might increase the market potential by reducing deprivations in health, education and/or standard of living of the residents.